
Insights
Understanding Data Visualization: a Guide
Discover how effective data visualization transforms complex information into clear, compelling stories that make insights easier to understand, reveal meaningful patterns and empower teams to communicate findings and make more informed decisions.
What Is Data Visualization?
A Creative’s Guide to Making Data Make Sense
Data visualization transforms raw data into charts, graphs, and infographics. With it, numbers turn into visuals that can communicate patterns and trends more effectively than raw data ever could. Whether you’re tracking user engagement, sales, or demographic shifts, data visualization is the tool that enables you to extract meaning from your data and communicate it efficiently.
Most professionals rely on visualizations every day to sift through complex datasets and extract actionable insights. However, effective data visualization takes skill, creativity, and experience. It’s not just plugging numbers into a chart—it’s about crafting a visual narrative that conveys the right story to the right audience. Experienced creative professionals familiar with idea illustration can translate your raw data into meaningful, compelling visuals that can inform decisions and guide strategy.

What is meant by data visualization?
Data viz turns information about your business into visual formats such as charts, graphs, or maps. Instead of reading lines of numbers and searching for how they connect, viewers can glance at a well-designed graphical representation of the information and immediately understand trends, outliers, and patterns.
Well-designed visualizations go beyond aesthetics—they serve a purpose by making complex information easier to comprehend, share, and discuss. Whether you’re presenting to a room of technical experts or business stakeholders with no technical background, visualizations ensure that everyone understands the key takeaways.
Why is data visualization important?
So, why do we bother turning raw data into visuals? Why not just look at tables and rows of numbers?
The answer lies in how our brains process information. People are wired to process visuals faster than text or raw data. A simple graph can reveal patterns, trends, or anomalies that might otherwise be buried under rows of numbers. It helps us understand the significance of the data—whether it’s spotting a dip in customer engagement or forecasting the next big sales spike.
Explore how data can enhance customer engagement.
Data visualization also plays a big role in effective collaboration. When you present complex data as easy-to-understand visual representations, teams across departments can quickly understand the information. This means more people can contribute to informed decision-making, which can spark innovation and improve outcomes.
Three Key Ways Data Visualization Helps Viewers
Faster Processing – Humans process images faster than text or numbers. A chart or graph makes it easier to identify critical insights at a glance.
Contextual Understanding – Visualization allows data to be seen in context, helping to reveal cause-and-effect relationships that might not be evident in raw data.
Trends Over Time – Visuals can quickly show how things evolve, giving viewers a clearer picture of growth, decline, or fluctuations in key metrics.
Data Vis in Action – Sales Performance Across Regions Over Time
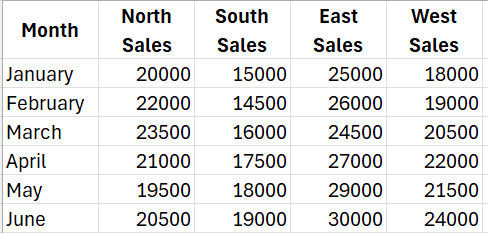
Let’s say a company tracks its monthly sales performance across four regions: North, South, East, and West. Here’s a sample of the raw sales data for the first six months of the year:
While these numbers give raw information, spotting trends or comparisons across regions and time is challenging.
By transforming this data into a line graph, you can instantly see:
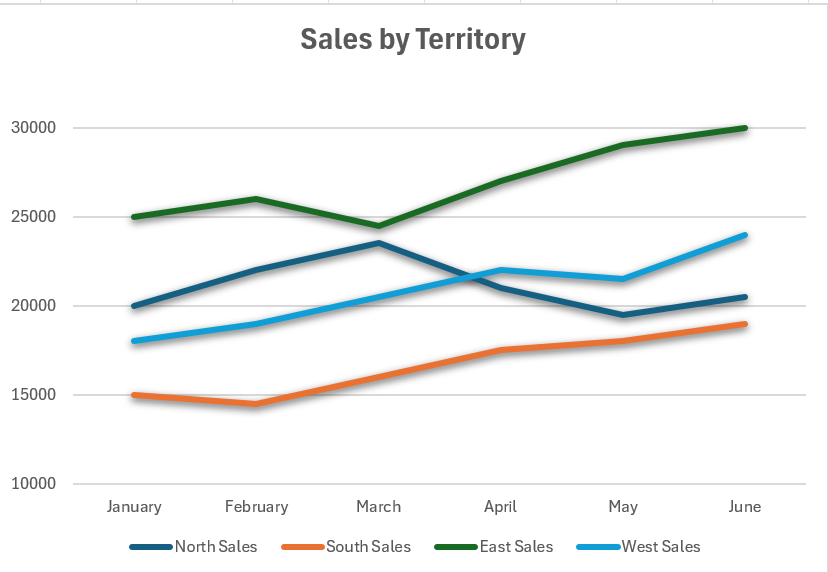
Visualization: Line Graph with Multiple Trend Lines
Trends Over Time:
Sales growth in each region becomes visually apparent. For example, the line graph would clearly show that the East consistently outperforms other regions and is experiencing steady growth. Meanwhile, the South region, though improving, has relatively lower sales.
Comparisons Across Regions:
It’s easy to see that the West region had a major uptick in May and June, which might indicate the success of a marketing push or seasonal demand.
Anomalies:
Any sudden spikes or dips in sales are immediately visible. For instance, in April, North showed a noticeable dip compared to previous months, prompting further investigation.
Without the line graph, these trends are much harder to identify. The visualization provides a clear narrative of growth, regional performance, and potential areas of concern or opportunity.
This is a simple example, but imagine what you can do with more complex data sets. You can supplement it with an interactive map of products sold by territory, or per salesperson. Bring in product stock data to help you decide which projects to place on promotion, in which region. The possibilities are endless!
What Are Some Examples of Good Data Visualization?
Good data visualization always serves a purpose. It allows the viewer to engage with the data set without needing an advanced technical background. Some classic examples include:
Bar Charts – These categorize elements by size, such as showing monthly sales or product popularity.
Line Charts – Ideal for displaying trends over time, such as revenue growth or seasonal patterns.
Heat Maps – These show data density using colors, making them perfect for displaying website traffic or geographical engagement.
Pie Charts – Although somewhat limited, pie charts still serve a role in showing parts of a whole, such as market share distribution.
Choosing the right type of visualization depends on the story you’re trying to tell.
What Makes Data Visualization Effective?
An effective visualization doesn’t just look good—it tells a clear, insightful story. Here’s what you need for success:
Clear Purpose – Define what you want to communicate. Are you showing a trend? Highlighting an anomaly? The design should support this goal.
Know Your Audience – A technical team may appreciate detailed visualizations, while an executive team may need the same information distilled into simpler, high-level graphics.
Accurate Data – Visualization is only as good as the data behind it. Start with accurate, high-quality data to ensure your visuals convey the correct insights.
Design and Aesthetics – Simplicity is key. Overcomplicated graphics can confuse the viewer, so use color, labels, and layout wisely to make the data easy to understand.
How to Achieve Effective Data Visualization
Creating effective data visualizations requires the right tools, design expertise, and a deep understanding of the underlying data. It’s not just about throwing data into a graph—there are best practices that professionals follow to ensure the visual story is accurate and insightful.
To achieve the best results:
Integrate and Harmonize Data – Good data management and combining data from different sources provides a more holistic view of your business.
Tailor Visuals to Your Audience – Ensure that your visualization speaks to the needs and interests of your audience, whether they’re marketing professionals or senior executives.
Use Real-Time Dashboards – These offer dynamic, up-to-date views of business performance, helping teams make informed decisions quickly.

Top Data Visualization Tools
1. Tableau
Overview: One of the most popular and powerful data visualization tools, Tableau is known for its ability to handle large datasets and produce interactive, shareable dashboards. It supports integration with multiple data sources and offers both desktop and cloud-based solutions.
Key Features: Drag-and-drop interface, real-time data analysis, interactive visualizations, and support for collaboration.
Best For: Businesses that need to create complex visualizations quickly and share them across teams.
2. Power BI
Overview: Microsoft’s Power BI is a business analytics tool that allows users to create data visualizations and dashboards with ease. It integrates seamlessly with other Microsoft products and offers strong capabilities for real-time data reporting.
Key Features: Real-time dashboards, AI-driven analytics, integration with Excel, and strong collaboration tools.
Best For: Companies already using Microsoft products or those that need easy integration with various data sources.
3. Google Data Studio
Overview: A free, web-based data visualization tool by Google, Data Studio allows users to create customizable dashboards and reports using data from Google’s suite of services (like Google Analytics, Google Sheets, and more), as well as other sources.
Key Features: Easy sharing, collaboration, integration with Google products, and customizable templates.
Best For: Users who need an easy-to-use, cost-effective solution for Google data integration.
4. D3.js
Overview: D3.js (Data-Driven Documents) is a JavaScript library used to create custom data visualizations in a web browser. It provides great flexibility but requires coding knowledge.
Key Features: Highly customizable, open-source, works well with modern web standards, and supports interactive and animated visualizations.
Best For: Developers or teams with coding skills who need highly customized data visualizations.
5. Qlik Sense
Overview: Qlik Sense is a data analytics and visualization tool that offers interactive visualizations, data integration, and AI-powered insights. It’s known for its associative data model, which allows users to explore data freely without predefined paths.
Key Features: Associative data engine, AI assistance, self-service data analytics, and advanced reporting.
Best For: Businesses looking for powerful data discovery and analytics with a focus on AI-driven insights.
6. Looker
Overview: A data analytics and visualization platform now part of Google Cloud, Looker specializes in providing real-time data insights and integrating data from multiple sources. It offers strong data exploration and collaboration features.
Key Features: Real-time dashboards, collaboration tools, integration with various data sources, and an emphasis on business intelligence.
Best For: Companies looking for a BI tool with strong data integration capabilities, especially those working in the Google Cloud environment.
7. Chart.js
Overview: Chart.js is a simple, open-source JavaScript library that allows users to create basic data visualizations such as bar, line, and pie charts. It’s popular among developers due to its simplicity and flexibility.
Key Features: Lightweight, easy to use, supports several chart types, and responsive on different devices.
Best For: Developers who need simple, fast visualizations without a steep learning curve.
8. Sisense
Overview: Sisense is a robust business intelligence tool that allows users to mash up data from different sources and generate interactive dashboards. It’s particularly known for handling large datasets and embedding analytics into products or workflows.
Key Features: AI-driven analytics, scalable architecture, integration with various data sources, and a strong focus on embedding analytics.
Best For: Enterprises that need to handle large datasets or embed analytics into customer-facing applications.
9. Infogram
Overview: A web-based tool designed to create simple infographics, charts, and reports quickly. Infogram has pre-built templates that make it easy to create visually appealing data visualizations with minimal effort.
Key Features: Drag-and-drop functionality, a variety of templates, real-time data updates, and an emphasis on ease of use.
Best For: Marketers or educators looking for a quick way to create visually appealing infographics and reports.
10. Zoho Analytics
Overview: Zoho Analytics is part of the broader Zoho suite and offers advanced data visualization and analytics tools. It enables users to create dashboards, visualizations, and reports with ease, integrating with various Zoho products and other data sources.
Key Features: AI-powered insights, customizable dashboards, data blending from multiple sources, and collaboration tools.
Best For: Small to medium businesses, especially those using the Zoho ecosystem.
11. Plotly
Overview: Plotly is a graphing and analytics platform that enables users to create interactive, web-based visualizations. Plotly supports a wide range of chart types, including 3D visualizations.
Key Features: Interactive and shareable visualizations, open-source graphing library, and enterprise-grade security.
Best For: Users who need detailed, interactive visualizations for scientific or complex data.
Drive Results for your Business
At Creatives On Call, we specialize in tailoring these insights to fit your organization, helping you unlock meaningful transformation that drives results.

How to Make Data Visualization Meaningful for Your Business
For data visualization to be meaningful, it must be connected to your business goals. Ask yourself: What are the key metrics that influence your bottom line? Focus on visualizing data that reflects your organization’s strategic objectives. For example, tracking customer engagement, inventory levels, or ad campaign performance in visual formats can offer immediate insight into how to optimize your operations.
To help identify your most important KPIs, check out our Strategy and Advisory Services
Collaborating with a creative team can help take your visualizations to the next level. They’ll understand how to communicate complex data in ways that resonate with both internal teams and external audiences.
The Creative Advantage
It’s tempting to think you can do data visualization on your own, but working with professionals makes a significant difference. Creatives understand the nuances of design, color theory, and user experience, ensuring that your data is presented in the clearest, most compelling way possible.
Accessibility in Data Visualization
An often overlooked aspect of effective data visualization is accessibility. In our diverse work environments, it’s important to ensure that data visuals are easy to interpret for all users. Creatives who specialize in data visualization can help you design graphics that are not only informative but also inclusive. Here’s how accessibility is incorporated into professional data visualizations:
Color Choices – Relying too much on color alone to convey meaning can be problematic for individuals with color blindness. Using patterns, textures, and clearly labeled sections ensures that everyone can interpret the data.
Alternative Text – For those using screen readers, alt text is crucial. Every visual element should have a descriptive text alternative that clearly explains the information being conveyed.
Readable Fonts and Sizes – Text within visualizations should be large enough to read easily and use legible fonts.
Interactive Features – Interactive data visualizations can provide multiple ways for users to engage with the content, including keyboard navigation for those who can’t use a mouse.
Clear Labels and Legends – Well-designed labels and legends make visualizations easier to understand for everyone, not just those with disabilities.
By partnering with creative professionals, you not only ensure that your data is beautifully presented but also make sure that it’s accessible to a wider audience.
What’s Next for Data Visualization?
Data visualization is evolving at a rapid pace, with new technologies and techniques enhancing how we interpret and interact with data. Here are some key trends shaping the future:
Augmented and Virtual Reality (AR/VR) – AR and VR are emerging as cutting-edge tools for immersive data visualization. Imagine being able to “walk through” a 3D representation of your data, interacting with different layers to explore trends and insights in a fully immersive environment. These technologies allow for more dynamic presentations of complex datasets, particularly useful in fields like architecture, engineering, and scientific research.
AI-Powered Visualization Tools – Artificial Intelligence is beginning to play a larger role in data visualization. AI can help detect patterns or anomalies in datasets that may not be immediately apparent. It can also assist in automatically choosing the best visualization format based on the data and the audience, streamlining the process of turning raw data into actionable visuals.
Data Storytelling – Visualization is becoming more than just presenting numbers—it’s about telling compelling data-driven stories. This involves not only showing the “what” but also the “why” behind the data. Tools are increasingly focusing on building narratives within the visualizations themselves, helping users move from insight to action.
Interactive and Predictive Dashboards – As users demand more control over their data, interactive dashboards will become more prevalent. These dashboards allow users to customize views, filter datasets, and drill down into specific metrics in real time. Predictive analytics, powered by AI, can also forecast trends and provide insights into future outcomes based on historical data.
Data Democratization – As more non-technical users need access to data, the demand for user-friendly tools is increasing. Visualization platforms are evolving to simplify complex data processes, making it easier for anyone, regardless of technical expertise, to create meaningful visualizations.

Partner with Experts to Bring Your Data to Life
Translating complex data into clear and compelling visuals can have a significant impact on your business. Whether you’re aiming to improve customer engagement, monitor key metrics, or streamline decision-making, working with a skilled creative team can elevate your data storytelling.
Working with Creatives On Call, you gain access to a talented pool of professionals who specialize in data visualization, user experience, and designing the visual elements you need to convey your message. From planning to execution, we help businesses craft visual narratives that resonate with their target audience. Learn more about our Data Visualization Consulting Services, here.
Content & Knowledge Management Capabilities
Our strategy and advisory services are designed to give you a comprehensive view of your organizational capabilities, then unlock avenues for innovation and growth.
Content Creation & Management
The need for smart influential content is greater than ever before. We drive revenue by gaining influence, targeting engagement, and initiating action.
Strategy & Advisory
Our strategy and advisory services are designed to give you a comprehensive view of your organizational capabilities, then unlock avenues for innovation and growth.
Learning & Knowledge Management
Accelerate your organization’s learning and implement knowledge practices that yield operational results.
You've Seen What We Do.
Let's Talk About What You Need.
The right team, the right expertise, and the right process are already here. The next step is the conversation.